

Market Update - 17 March 2020
Zenith Investment Partners have provided the following update.
After peaking on the 19th February 2020, domestic and global shares have sold off aggressively due mostly to fears about the economic impact of the COVID-19 outbreak. Up to the 16th March 2020, the recent selloff had resulted in a peak to trough drawdown in US shares of 29.53%, as measured by the S&P 500. As such, it has only taken 17 days for the market to incur losses of nearly 30%, marking the sharpest drawdown for the S&P 500 since 1987. Australia, as represented by the ASX 300, has fared similarly, experiencing a peak to trough selloff of 30.31%.
So, to re-iterate, whilst the size of the drawdown is consistent with historical observations, the accelerated timeframe of the drawdown has been atypical. There is a general belief that advancements in technology, both regarding electronic trading systems and increased availability for retail investors of easily traded investment vehicles, such as Exchange Traded Funds (ETFs) and Listed Investment Companies (LICs), and the ready access and flow of market information has enabled faster trading patterns.
Beyond the retail market participants, high frequency trading (HFT) strategies continue to engage in an “arms race” to incorporate information into trades as quickly as possible. While broader prime broking business arms have seen diminishing profitability, which has resulted in their reduced balance sheets and ultimately a lower provision of liquidity to the market.
Furthermore, society is increasingly bombarded with news through various forms of media that often sensationalise information. As a result, reactions to the release of information tends to exaggerate market movements, both positive and negative.
These changes to the investment landscape have contributed to the trend of shorter time periods for a market downturn and subsequent recovery. In this piece, we explore the challenges presented to investors by increased drawdown speeds and how to navigate such environments.
Faster and faster
To illustrate the increased speeds in equity downturns and subsequent recoveries, we have investigated drawdowns in US equities, as represented by the S&P 500 Total Return Index (in local currency), that exceeded a peak to trough loss of 10% in the last 20 years.
The US equity market has been used as it accounts for the greatest proportion of global markets and has available data for the past 20 years on a total return basis. A drawdown is defined as ending once peak to trough losses have been entirely recouped.
|
Event |
Drawdown Start |
Drawdown End |
Max Drawdown |
Days in Drawdown |
Days in Recovery |
Total Drawdown Length |
|
Tech Bubble |
1.09.2000 |
23.10.2006 |
-47.41% |
529 |
1016 |
1545 |
|
GFC |
9.10.2007 |
2.04.2012 |
-55.25% |
355 |
773 |
1128 |
|
Oil Crisis |
17.01.2015 |
18.04.2016 |
-12.96% |
143 |
44 |
187 |
|
Fed Pivot |
20.09.2018 |
12.04.2019 |
-19.36% |
65 |
74 |
139 |
|
COVID-19* |
19.02.2020 |
n/a |
-29.53% |
17* |
n/a |
n/a |
Source: Zenith Investment Partners, Bloomberg. *Drawdown in progress
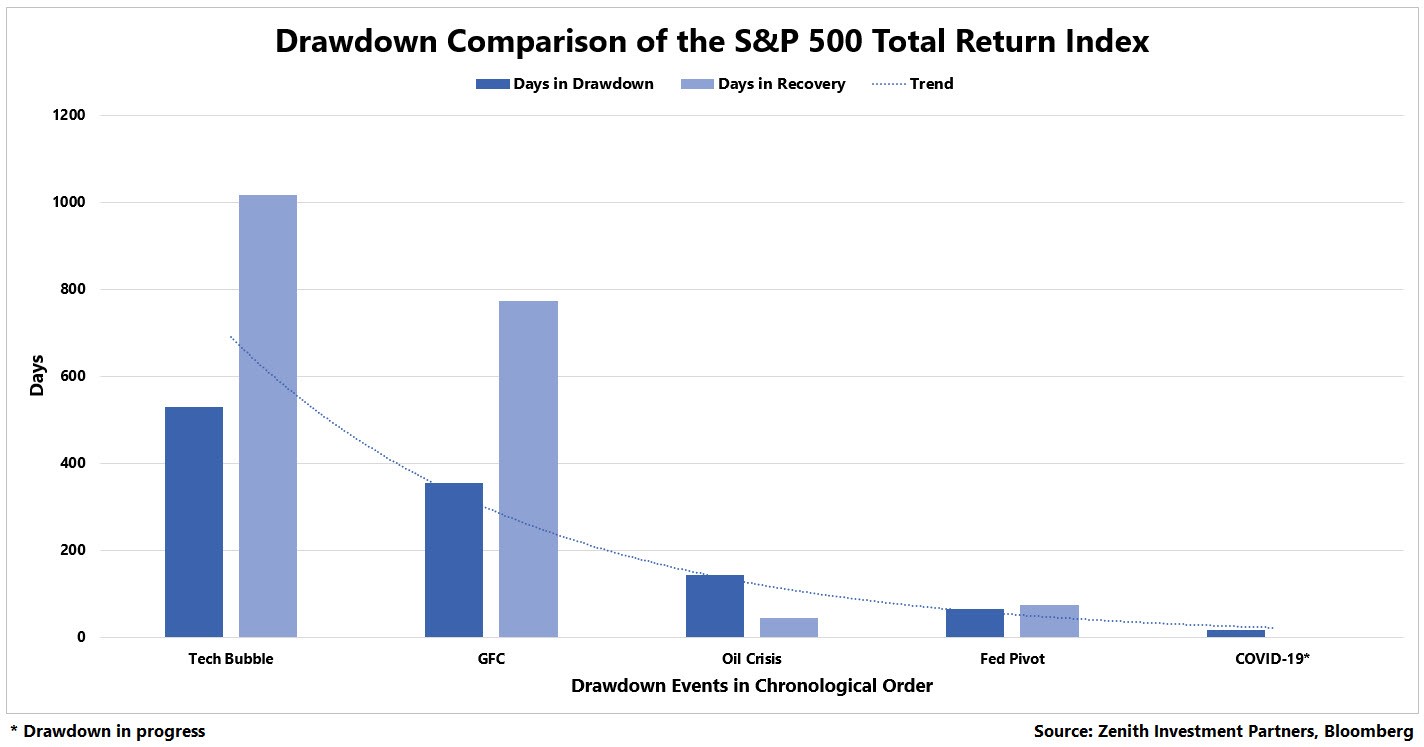
As can be seen in the chart above, there is a reduction in both the days in drawdown and recovery over time. While the extent of the current drawdown caused by the outbreak of COVID-19 is yet to be known, the speed of the drawdown to date has followed this historical trend.
Challenges for investors
Simply put, faster market movements mean a faster response is required to enact market timing strategies. In our market release from last week, Temptations of Market Timing, we explored how unrealistically difficult it is to time the market successfully. As the magnitude of market moves increases and the pace of the market picks up, market timing becomes an even more arduous strategy to enact.
Taking the last few days as an example, the S&P 500 Index was down 9.52%, up 9.29% and down 11.98% on the 12th, 13th and 16th of March 2020, respectively. Even mistiming the market rebound by one day in these instances could have resulted in significant losses to long term returns.
The following chart shows how the size of daily moves has been magnified in the most recent downturn:
|
Event |
Average Size of Daily Move During Drawdown |
|
Tech Bubble |
0.80% |
|
GFC |
1.15% |
|
Oil Crisis |
0.85% |
|
Fed Pivot |
0.80% |
|
COVID-19* |
4.14% |
Source: Zenith Investment Partners, Bloomberg. *Drawdown in progress
But this hypothetical example does not factor the time delay associated with transactions. The time for the settlement on a sale of a managed fund can range from a few days to a few weeks depending on the nature and liquidity of the strategy and administration platform (if used).
Similarly to the risks of market timing, transacting during these volatile markets, results in capital being out of the market until settlement is complete. As the size of daily market returns becomes more prominent, the probability of missing out on large and short-term market recoveries increases.
How do our portfolios respond to these challenges?
These large and fast market movements can be highly daunting for investors and send most on an emotional rollercoaster. These short-term bouts further emphasise our belief to remain invested rather than attempt to engage in risky market timing. We expect this approach to optimise long term risk-adjusted returns, especially as the speed of market movements rapidly increases.
In terms of our portfolio rebalancing approach, we acknowledge that these large moves can often result in deviations from desired long-term allocations both at a fund and asset class level. While it is our preference to rebalance portfolios where predefined ranges have been breached, we are wary of the potential for high magnitude market movements, both positive and negative, that can make rebalancing actions redundant. For this reason, we err to the side of caution and where market volatility is heightened, we will delay rebalancing until volatility reduces and/or portfolio weightings become excessively distorted.
Our investment philosophy remains focused on long term objectives and outcomes. This translates both into our fund and strategy selection. We would not expect our underlying managers to make drastic shifts in positioning during these volatile markets and rather stay focused on their long-term investment theses. This avoids crystallising losses incurred from potential short-term market reversals.